
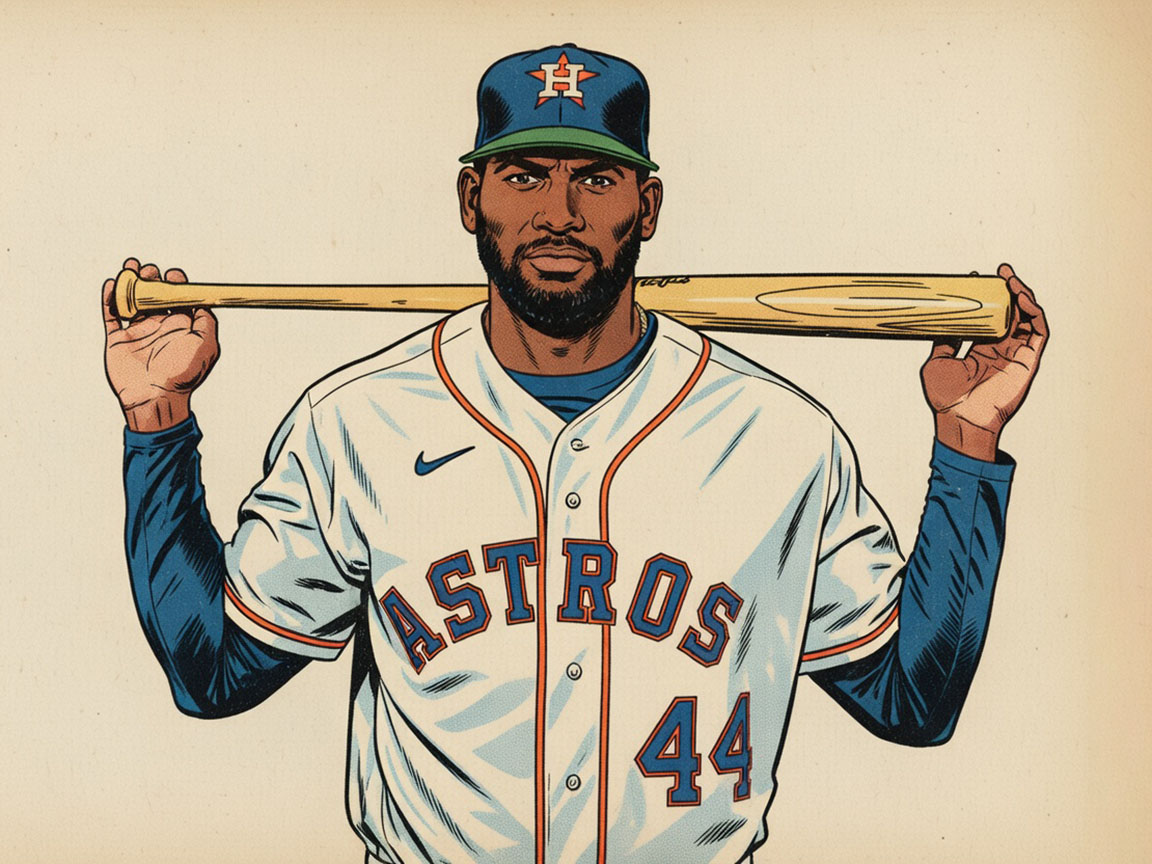
2026 MLB Season • Statistics Through July 12, 2026
Who Owned the Offensive Conversation in the First Half?
The first half produced a mix of established stars, young power hitters and unexpected league leaders. This page highlights the players who entered the All-Star break leading Major League Baseball’s most important offensive categories.
Rate-stat categories include qualified hitters only. Ties are shown when players finished the first half with the same total.
First Half at a Glance
| Category | Leader | Team | Stat |
|---|---|---|---|
| Batting Average | Otto Lopez | Miami Marlins | .334 |
| Home Runs | Kyle Schwarber | Philadelphia Phillies | 32 |
| Runs Batted In | Jordan Walker | St. Louis Cardinals | 74 |
| Runs Scored | James Wood | Washington Nationals | 89 |
| Hits | Otto Lopez | Miami Marlins | 127 |
| Stolen Bases | Nasim Nuñez | Washington Nationals | 34 |
| On-Base Percentage | Yordan Alvarez | Houston Astros | .426 |
| OPS | Yordan Alvarez | Houston Astros | 1.059 |
Batting Average
Qualified hitters ranked by batting average at the All-Star break.
| Rank | Player | Team | AVG |
|---|---|---|---|
| 1 | Otto Lopez | MIA | .334 |
| 2 | Luis Arraez | SF | .330 |
| 3 | Yandy Díaz | TB | .322 |
| 4 | Yordan Alvarez | HOU | .318 |
| 5 | Nick Gonzales | PIT | .308 |
Home Runs
The first-half power race remained tightly packed behind Schwarber.
| Rank | Player | Team | HR |
|---|---|---|---|
| 1 | Kyle Schwarber | PHI | 32 |
| 2 | Yordan Alvarez | HOU | 31 |
| 3 | Ben Rice | NYY | 29 |
| T-4 | Junior Caminero | TB | 28 |
| T-4 | James Wood | WSH | 28 |
Runs Batted In
Jordan Walker entered the break with the major league lead in run production.
| Rank | Player | Team | RBI |
|---|---|---|---|
| 1 | Jordan Walker | STL | 74 |
| 2 | Yordan Alvarez | HOU | 70 |
| T-3 | Luis García Jr. | WSH | 68 |
| T-3 | Ben Rice | NYY | 68 |
| T-5 | CJ Abrams | WSH | 67 |
| T-5 | Alec Burleson | STL | 67 |
Runs Scored
James Wood reached the break well clear of the rest of the field.
| Rank | Player | Team | R |
|---|---|---|---|
| 1 | James Wood | WSH | 89 |
| 2 | Bryan Reynolds | PIT | 68 |
| 3 | Zach Neto | LAA | 67 |
| 4 | Brice Turang | MIL | 66 |
| T-5 | Yordan Alvarez | HOU | 65 |
| T-5 | Shohei Ohtani | LAD | 65 |
Hits
Otto Lopez paired the batting title lead with the most hits in baseball.
| Rank | Player | Team | H |
|---|---|---|---|
| 1 | Otto Lopez | MIA | 127 |
| 2 | Luis Arraez | SF | 119 |
| T-3 | Yordan Alvarez | HOU | 111 |
| T-3 | Yandy Díaz | TB | 111 |
| 5 | Xavier Edwards | MIA | 107 |
Stolen Bases
Nasim Nuñez set the first-half pace with 34 steals.
| Rank | Player | Team | SB |
|---|---|---|---|
| 1 | Nasim Nuñez | WSH | 34 |
| 2 | Bobby Witt Jr. | KC | 30 |
| 3 | Jazz Chisholm Jr. | NYY | 26 |
| T-4 | Pete Crow-Armstrong | CHC | 24 |
| T-4 | José Ramírez | CLE | 24 |
On-Base Percentage
Qualified hitters ranked by their ability to reach base.
| Rank | Player | Team | OBP |
|---|---|---|---|
| 1 | Yordan Alvarez | HOU | .426 |
| 2 | James Wood | WSH | .410 |
| T-3 | Juan Soto | NYM | .405 |
| T-3 | Nick Kurtz | ATH | .405 |
| 5 | Shohei Ohtani | LAD | .403 |
OPS
Yordan Alvarez finished the first half as the only qualified hitter above 1.000.
| Rank | Player | Team | OPS |
|---|---|---|---|
| 1 | Yordan Alvarez | HOU | 1.059 |
| 2 | James Wood | WSH | .985 |
| 3 | Ben Rice | NYY | .971 |
| 4 | Juan Soto | NYM | .967 |
| 5 | Shohei Ohtani | LAD | .952 |
First-Half Offensive Standouts
- Yordan Alvarez: Led MLB in OBP and OPS, finished second in home runs and RBI, and tied for third in hits.
- James Wood: Led the majors in runs and walks while ranking among the leaders in home runs, OBP and OPS.
- Otto Lopez: Entered the break leading MLB in both batting average and hits.
- Jordan Walker: Led the majors with 74 RBI before winning the Home Run Derby during All-Star Week.
- Junior Caminero: Reached 28 home runs after producing one of the season’s most memorable power streaks.
DataBaseball Offensive Player of the First Half
Yordan Alvarez, Houston Astros
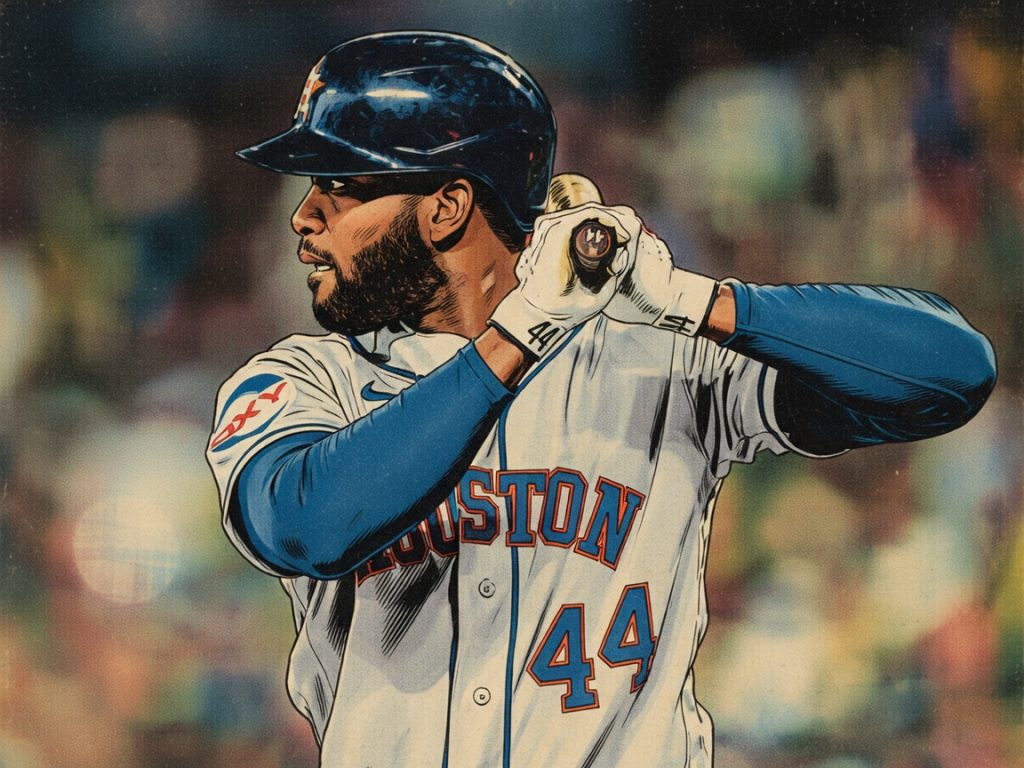
Alvarez produced the most complete offensive line of the first half. He entered the break batting .318 with 31 home runs, 70 RBI, a .426 on-base percentage, a .633 slugging percentage and a 1.059 OPS.
He combined elite power with consistent contact and plate discipline, placing near the top of nearly every major offensive category.
About These Leaders
Statistics reflect completed regular-season games through July 12, 2026. The All-Star Game and Home Run Derby are exhibitions and are not included in regular-season totals.
DataBaseball will revisit the offensive leaderboards during the season, with a final edition published after the conclusion of the regular season.